Measuring Corporate Knowledge Concentration in the Linux Kernel
Linux Kernel is one of the biggest collaborative software projects of the world. Mainly created by hobbists and enthusiats the Linux Kernel has become today a key project for so many devices that depend on it, that more than 80% of the contributions to kernel today are done by employees paid to contribute (!back by https://www.linuxfoundation.org/press/press-release/the-linux-foundation-releases-linux-development-report).
Open source is no longer a volunteer effort. It has become a way of companies to develop and make accessible products, such as Analog Devices with iio drivers, AMD with processors and gpus and others.
Measuring corporate knowledge
One gap for the existing literature is clearly understanding how companies acquire, manage and update their knowledge about the Linux kernel. The existing papers are vast in defining who is the most active, but they lack a vision directly related to the concentration of knowledge.
Knowledge itself it's impossible to be directly measured. So we can only use proxyes to it: concentration of commits on files; authorship of code submitted; and even participation in mailing lists.
The proposal here describe touches 4 dimensions:
- Measurement. How concentrated is source-code knowledge at the company level, and how does a company-level truck factor compare to the classic individual one?
- Divergence. Does corporate activity dominance line up with corporate knowledge dominance, or do they split apart?
- Fragility. Does measured knowledge concentration actually predict what happens when a firm withdraws: files orphaned, absorbed by another company, or retained?
- Governance. Does the concentration of maintainer authority track the concentration of code knowledge and of mailing-list participation? Do the different axes agree?
Measuring knowledge with cregit
To measure knowledge rather than activity directly, I build on cregit, a tool that had been dormant since 2023, so getting it to run again was a project in itself, which I wrote about in my notes on contributing to cregit.
Instead of attributing whole commits, cregit works at the level of individual
tokens of surviving source code, and traces each token back to the author
who introduced it. That gives a much more honest answer to "who holds the
knowledge of this code as it exists today" than commit-level git blame does.
The pipeline then joins three independent sources for each subsystem:
- cregit for token-level authorship of the code that survives today.
- A layered affiliation map (a curated override, then email domain, then the most recent corporate commit email) that resolves each developer, and each maintainer, to an employer. This borrows from gitdm-style resolution. Whatever stays unmapped is a genuine personal-email contributor, which is itself a signal.
- A mailing-list corpus for the participation and review side of the story.
From there I aggregate per-developer Degree-of-Authorship (DoA) up to the company. For a developer and a file , the DoA is:
where is first authorship (1 if created , otherwise 0), is the number of deliveries (changes made to ), and is the acceptances (changes to by everyone else). Summing each developer's DoA into their employer gives a per-file authorship share for each company.
On top of that I compute a company-level truck factor. A company counts as an expert on a file when it owns at least a fraction of that file's surviving tokens, and a file is orphaned once no company clears that bar. I use as the default and sweep it from 2% to 20% as a robustness check. The truck factor is then the smallest number of companies whose removal orphans more than half of the files:
The idea is lifted straight from Avelino et al.'s truck factor work on individuals, which the kernel-development literature already knows well, but pointed at firms instead of people. Their original criterion marks a developer as an expert via the normalized DoA above ( and ); the token-share rule is the surviving-token analogue I use for the headline firm-level numbers.
I summarize concentration with the usual inequality tools. Writing for the share of attributed tokens authored by firm , the Herfindahl index and the effective number of firms are:
so runs from (evenly spread across firms) to (a single firm owns everything), and reads that back as a count of equivalent equal-sized firms. I also report the Gini coefficient of the firm shares:
The Gini coefficient is a single number from to that measures how unevenly the tokens are split: it is literally the average absolute difference between every pair of firms' shares, normalized to land in . A Gini of means every firm owns exactly the same amount; a Gini approaching means one firm owns almost everything and the rest almost nothing. Where HHI (by squaring the shares) is dominated by the single largest firm and answers "is there one giant?", Gini looks at the whole spread and answers "is the field lopsided overall?", so two subsystems with a similar HHI can still differ in Gini if one has a long tail of tiny firms. I report both, and I put affiliation coverage next to every number so the reader knows how much of the code the claim actually rests on.
Known Problems
- Using e-mail domain to map person-to-firm: Some kernel engineer contribute to the kernel both on and off their companies. As we use the domain of their e-mail to map from their contributions to their companies, if they use a personal e-mail we will consider them a "Individual" not an employee.
A spectrum across three subsystems
We choose 3 subsystems to analyze:
drivers/iio(industrial I/O sensors): consultancy-mixed, predicted to be in the middle.net(the networking stack): many companies, the distributed case, should have many companies "disputing" over ownership.drivers/gpu/drm/amd(the AMD GPU driver): single-vendor, the extreme.
The preliminary numbers, from a working notebook with bootstrapped confidence intervals, land almost exactly where the case selection predicted:
iio: roughly 62% of surviving tokens are corporate-authored, spread across about eight effective firms (HHI ≈ 0.12), led by Analog Devices.net: roughly 59% corporate and the most distributed case, about thirteen effective firms (HHI ≈ 0.08), led by Red Hat and Intel across a long tail.amd: about 98% corporate and effectively one firm (HHI ≈ 0.97), AMD authors essentially all of the surviving tokens.
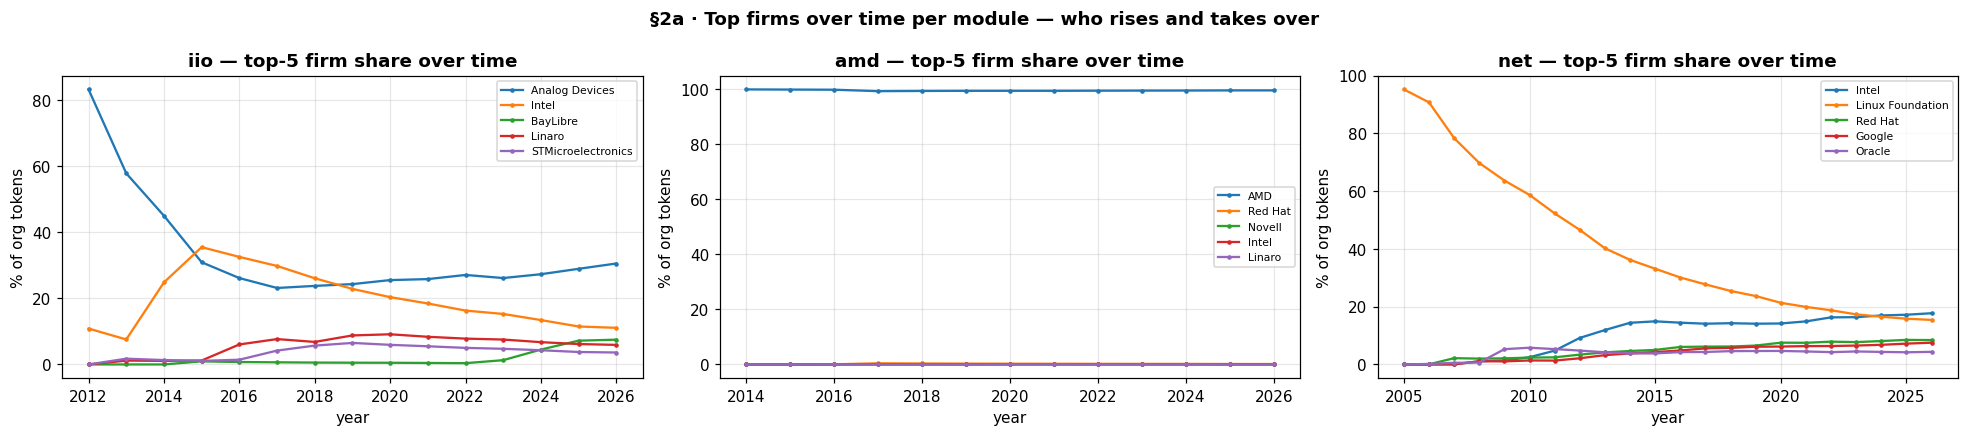
Top firms over time. AMD holds ~100% of amdgpu from the start; iio and net are contested, with firms rising and declining. Single-vendor capture versus a distributed field, in one picture.
The AMD result is the one that surprised me the most, so I pushed on it. The obvious objection is that a GPU driver is full of generated register headers, and that the concentration is just auto-generated echo. It is not. Excluding the machine-generated headers, even removing 13% of all of amd's token mass as a stress test, moves AMD's share by less than a tenth of a percentage point and leaves the concentration metrics unchanged. Single-vendor capture is a property of the hand-written driver, not of generated content.
Another way to see the gradient is to stack up who owns the surviving code, year
by year. In amd it is a single blue slab of AMD; in iio and net the same view is
a shifting patchwork of firms, and the (Unknown) band is a visible reminder of
how much of those subsystems we cannot yet attribute to any company.
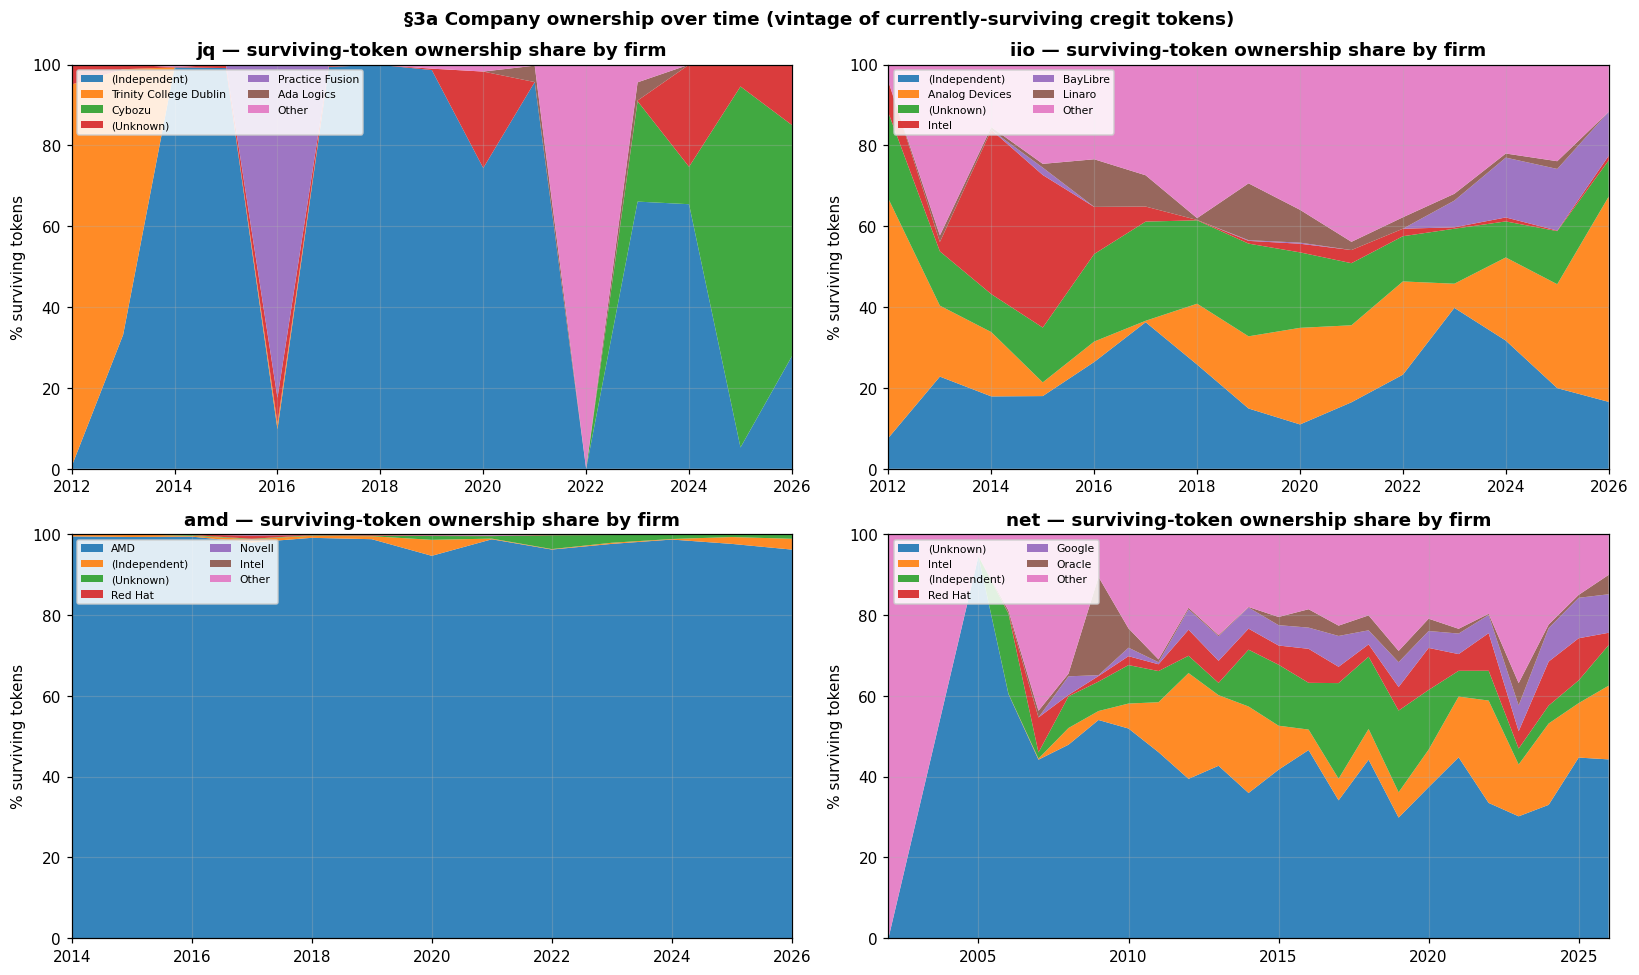
Surviving-token ownership by firm. amd is one company end to end; jq, iio, and net are shared across many, with a large unattributed band in net.
The truck factor tells the same story from another angle. The company truck factor, the number of firms you remove before most files are orphaned, is 1 for amd, 7 for iio, and 17 for net. One corporate decision at AMD would strand the majority of the driver; the networking stack would shrug off sixteen. That single-firm result for amd is pinned tight: across a thousand bootstrap resamples of the files, it never moves off 1.
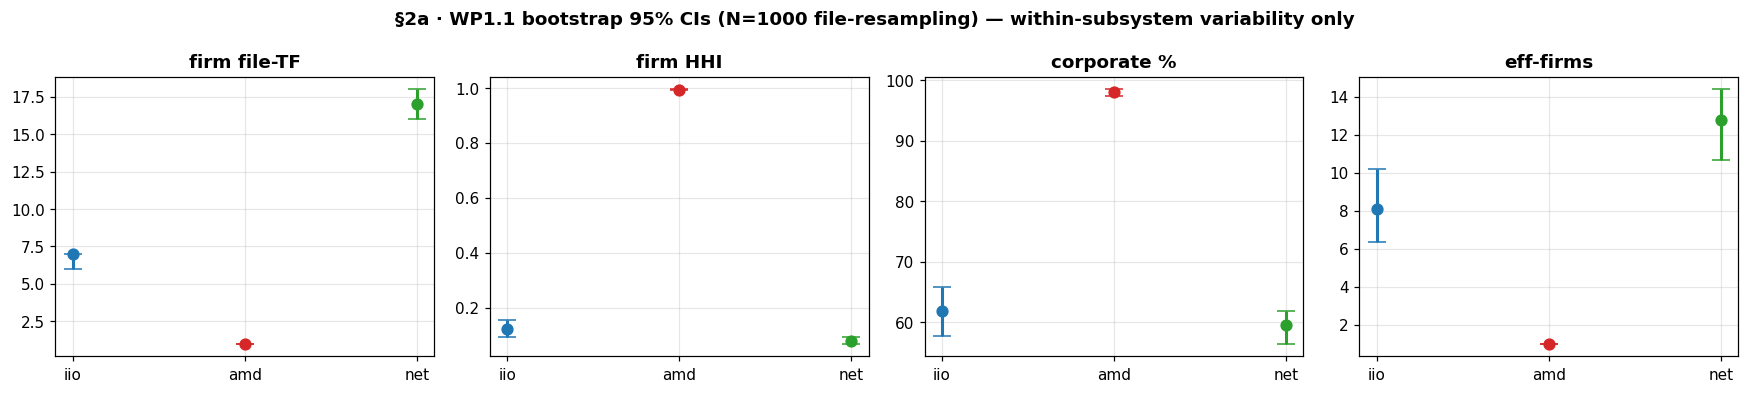
95% bootstrap confidence intervals (1,000 file resamples). The three subsystems separate cleanly on every metric, and amd's intervals are tight enough to render as dots.
Truck factor depends on where you draw the line for what counts as "knowing" a file, and if the whole picture flips when you nudge that threshold, the metric is not measuring much. So I swept it, from a generous 2% of a file's tokens up to a strict 20%. The individual counts move around, as you would expect, but the thing I actually care about, the ordering of the three subsystems, never flips: amd stays pinned at a company truck factor of 1 across the entire range, and net stays far above iio.
The reason amd is almost fully resolved is the same reason it is so
concentrated: it is a corporate monoculture where nearly everyone commits from
@amd.com. So the net and iio corporate percentages are best read as lower
bounds. When I resolve that tail properly — using the kernel's .mailmap,
cross-subsystem identities, and a hand-audited set of employer domains, each one
checkable against the commit data itself — coverage climbs from 62% to 76%
in iio and 59% to 82% in net, and the corporate share rises with it
(+12 points in iio, +21 in net), because a lot of those personal-email
commits really do come from company engineers.
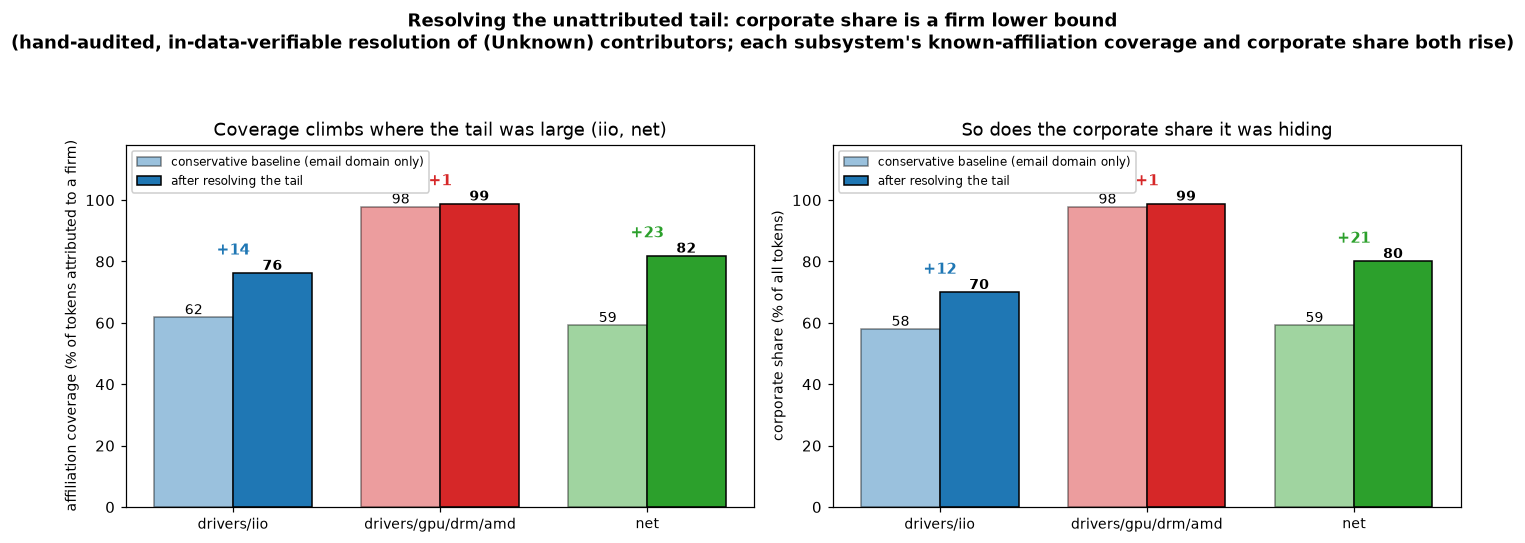
Resolving the unattributed tail. The two panels measure different things: the left is coverage (what fraction of tokens we can attribute to any employer at all), the right is the corporate slice of that (an employer that is specifically a company). Where the tail is large (iio, net), attributing it lifts both; amd was already near-complete. This is the lower bound made concrete: the corporate share is provably higher than the raw email-domain view shows.
But I have to be careful about what that does not say. My first instinct was
that resolving the tail would also make each subsystem look more concentrated,
fewer firms, each with a bigger share. It does not, at least not reliably: once
the tail is attributed, the concentration indices barely move, and the change is
not statistically distinguishable from zero. What the tail hides is not one more
giant but a mix. In net it is more Red Hat than the visible head suggested —
Red Hat is the single largest destination of the resolved tokens and jumps from
the fourth-largest firm to the second — but the rest is spread widely enough
that overall concentration is unchanged. So the honest reading is narrow: the
corporate share is a firm lower bound, but the concentration number is about
where it looks, not obviously higher or lower once the unknowns are filled in.
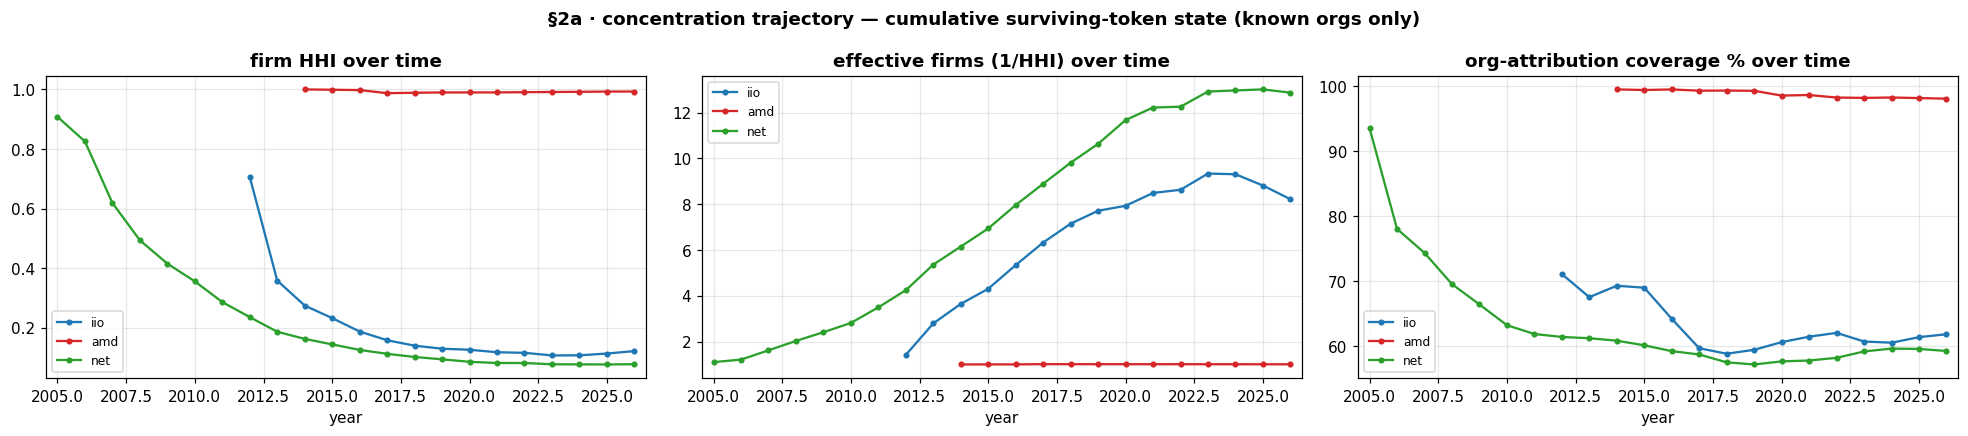
Concentration and coverage over time. The right panel is the caveat made visible: amd is attributed at ~98%, while iio and net plateau near 60%, so their concentration is measured on a partial view.
What happens when a company leaves
Since companies can acquire knowledge about the kernel, does this constitutes a fragility on the code?
I enumerated fifteen firm-exit events across the three subsystems and classified every predicted-fragile file as orphaned, absorbed by another company, or retained.
Each flagged file lands in one of three states, and the distinction matters: orphaned means nobody picked it up (no known firm clears the expertise bar afterward, so the knowledge genuinely fell on the floor); absorbed means a different company took it over and now dominates it; retained means the same firm still holds it despite the exit, usually because the departure was partial. Orphaned is the bad outcome; the other two are knowledge surviving, either in new hands or the original ones.
Across the genuine firm disengagements, only about 5% of the flagged files were actually orphaned; roughly 93% were absorbed by other companies and the rest retained. The truck factor reliably points at the files that depend on one firm, but the community, most of the time, catches them.
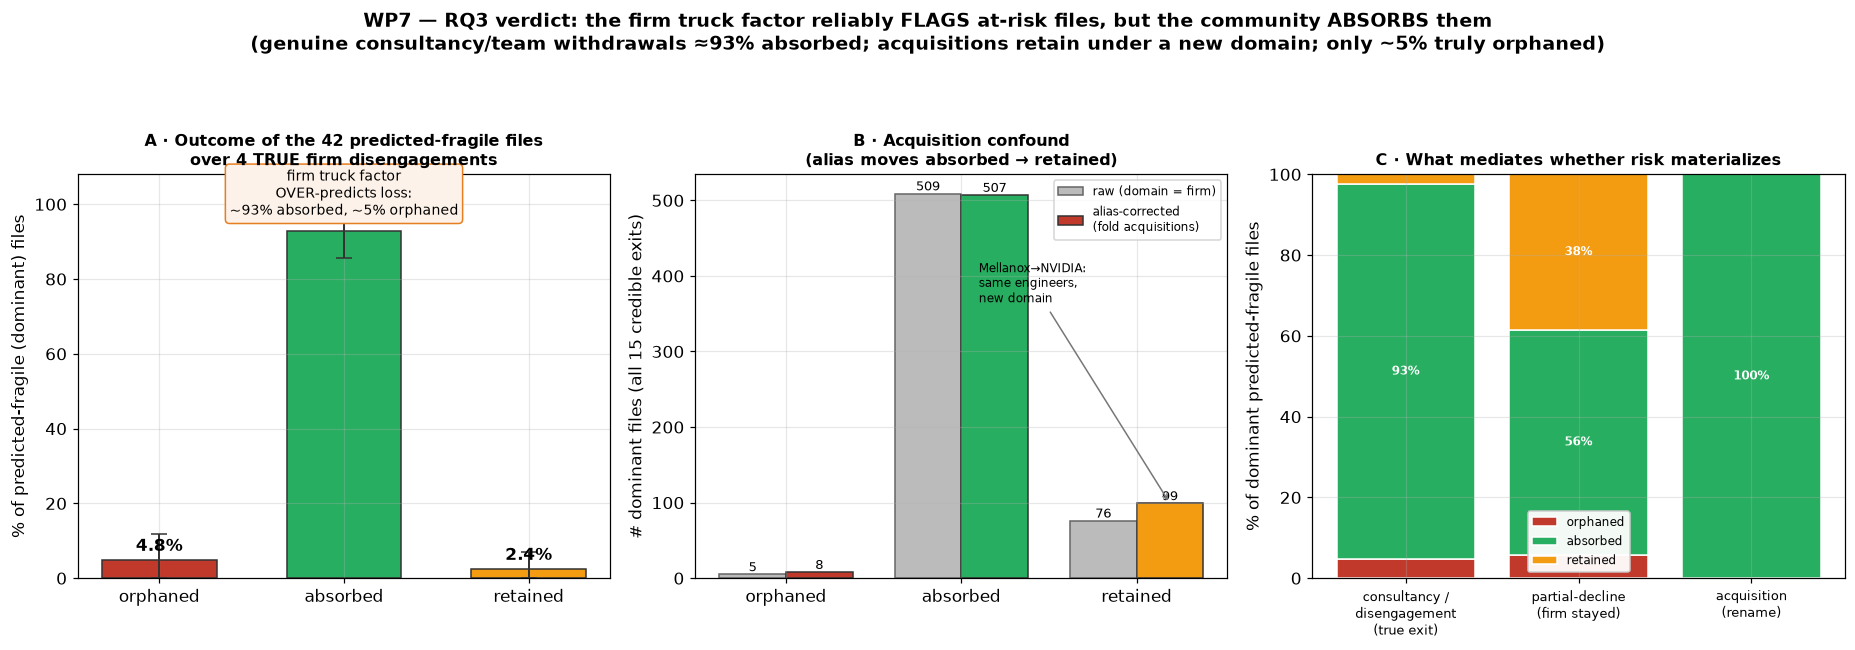
Outcomes of the files the truck factor flagged as at-risk, across the catalogue of firm exits. Genuine disengagements are mostly absorbed; acquisitions are retained under a new domain. Orphaning is the rare case.
Two exits are worth calling out because they pull in opposite directions and explain what decides the outcome:
- Pengutronix leaving
iio. A genuine consultancy disengagement, their share dropping from about 7.2% to 0.1%. Almost all of that work was one engineer, Uwe Kleine-König, who authored roughly 85% of Pengutronix's code in the subsystem. Of his dominated files, most were absorbed by other companies, ten by BayLibre, four by Huawei, one by Intel, and only two genuinely orphaned: the header filesbmg160.handltc2497.h, which received no further attention from any known firm. The community re-engaged around almost everything else. - Mellanox in
net, acquired by NVIDIA. The Mellanox networking team, led in the data by Jiri Pirko, one of netdev's most prolific contributors, simply kept working after the acquisition. Their dominated files show NVIDIA as the top post-exit contributor: the same people, a new email domain. A naive method that missed themellanox.com → nvidia.comrename would have scored this as a catastrophic 100% loss.
This lines up with Rigby et al.'s caution that naive truck-factor estimates exaggerate loss: a firm has many engineers, its departure is a decision rather than an accident, and knowledge can transfer intact. A truck factor of 1 is a map of strategic dependency, not a forecast of loss.
Following the people rather than the files tells the same story from the other
direction. Some engineers carry a large body of knowledge with them when they
genuinely change employers. Eric Dumazet, one of the most prolific networking
developers, moved to Google carrying well over a hundred thousand surviving
tokens of net code; in iio, Alexandru Ardelean went from Analog Devices to
BayLibre, the very consultancy that then absorbed much of the orphaned-risk work
above. That is knowledge moving between firms in the most literal way, one
career at a time.
But this is also exactly where the measurement has to be careful, because a
naive reading double-counts. The single largest apparent "job switch" in iio
is Jean-Baptiste Maneyrol moving from InvenSense to TDK, except that is not a
move at all: TDK acquired InvenSense, so it is the same person at the same
desk under a renamed employer. The same is true of the Mellanox-to-NVIDIA and
Free-Electrons-to- Bootlin transitions. If you do not fold these corporate
rebrands back together, you will mistake an acquisition for a talent exodus,
which is why every mobility number I quote is corrected for known renames before
anything is counted.
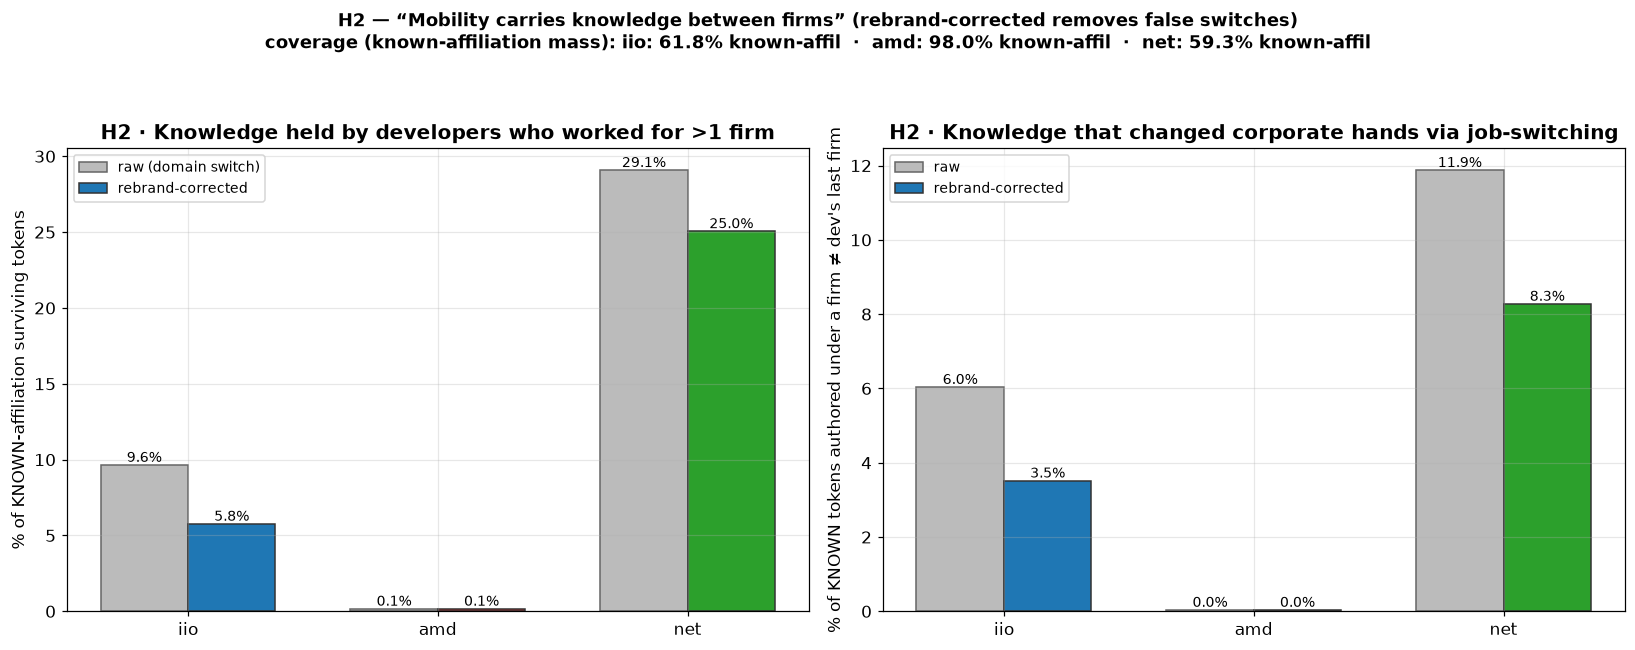
Developer mobility, raw versus rebrand-corrected. The two panels count different things: the left is a stock (how much surviving knowledge is held by anyone who has ever had more than one employer), the right is the stricter flow (knowledge authored under a firm that differs from the developer's current one, so it actually crossed a corporate boundary), which is why the right is always smaller. net is the mobile case (~25% of known knowledge held by multi-firm developers); amd is almost immobile. The gap between the grey and coloured bars is the acquisition-rename correction.
Code, governance, and conversation point the same way
The last piece is a convergent-validity check. Convergent validity is a idea from measurement: if several independent instruments that are supposed to capture the same underlying thing all agree, that agreement is evidence the thing is real and you are measuring it, rather than an artifact of one method. If corporate influence is real, it should show up on more than one axis. So I measure three independently, from entirely different data: code ownership (cregit tokens), governance (which company the maintainers work for), and participation (mailing-list discussion).
They agree, subsystem by subsystem. In amd, governance concentration is total:
all eight maintainers work for AMD, a governance HHI of 1.00 that
mirrors the code capture. In net, governance is dispersed across about
eleven effective employers (HHI ≈ 0.09), Red-Hat-led but spread wide,
mirroring its distributed code. iio sits in between, led by Analog Devices on
both axes. Code, governance, and conversation telling the same story in each
case is, to me, the strongest sign that the instrument is measuring something
real and not an artifact of one data source.
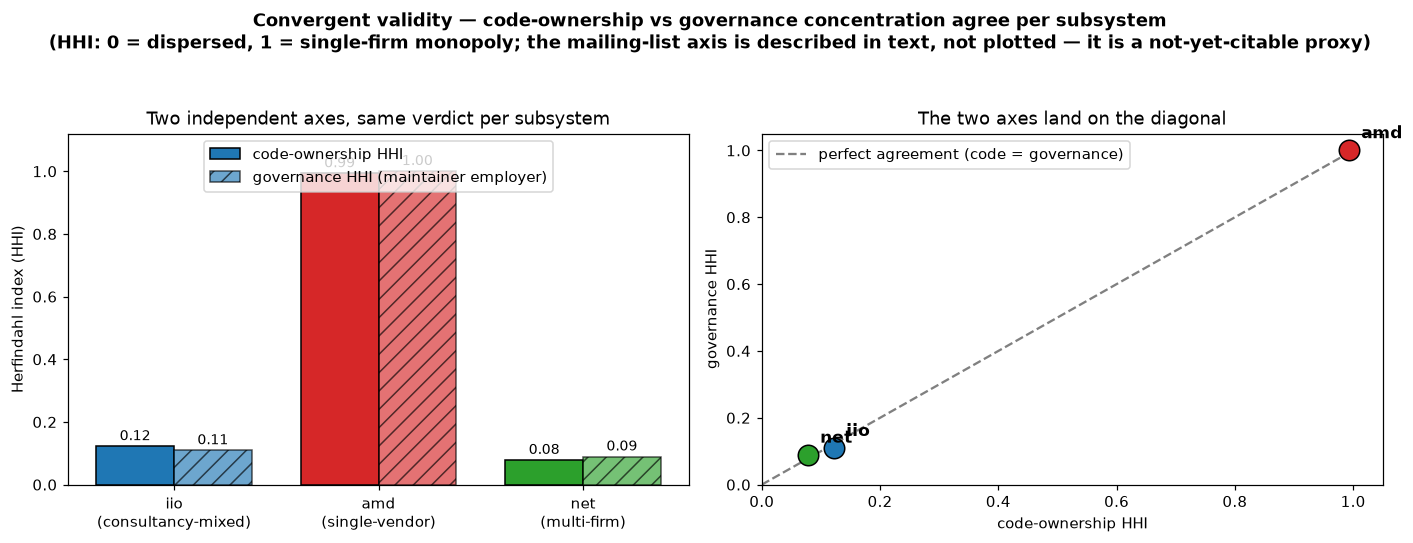
Two independent axes, one verdict. Code-ownership concentration and maintainer-governance concentration are near-identical per subsystem (amd ≈ 1.0 on both, net ≈ 0.08), landing on the agreement diagonal. The third axis — participation — needs unpacking rather than a single number, which is the next section.
Not all participation is the same participation
Collapsing "participation" into one number was hiding the most interesting structure in it. A patch carries different kinds of credit, and each is a different corporate signal: Signed-off-by is the maintainer's stamp that a patch may enter the tree (a gatekeeping act), Co-developed-by credits a second author who actually helped write it (collaboration), and Tested-by records who validated it (validation). I split each subsystem's trailers into those three channels and measured concentration in each separately.
They are three genuinely different maps, and none of them is the map of who owns the code. Signed-off-by is the most concentrated — often more concentrated than code ownership — because it flows through a handful of maintainers. Tested-by is the most distributed signal in the whole study: validation is a broad-ecosystem activity, spread across roughly 15 firms in iio and 18 in net, including distros and test shops that own essentially no code. Co-developed-by sits in between, and is the trailer that diverges most from ownership everywhere (its rank correlation with code ownership is only 0.25–0.40, against 0.58–0.90 for Signed-off-by).
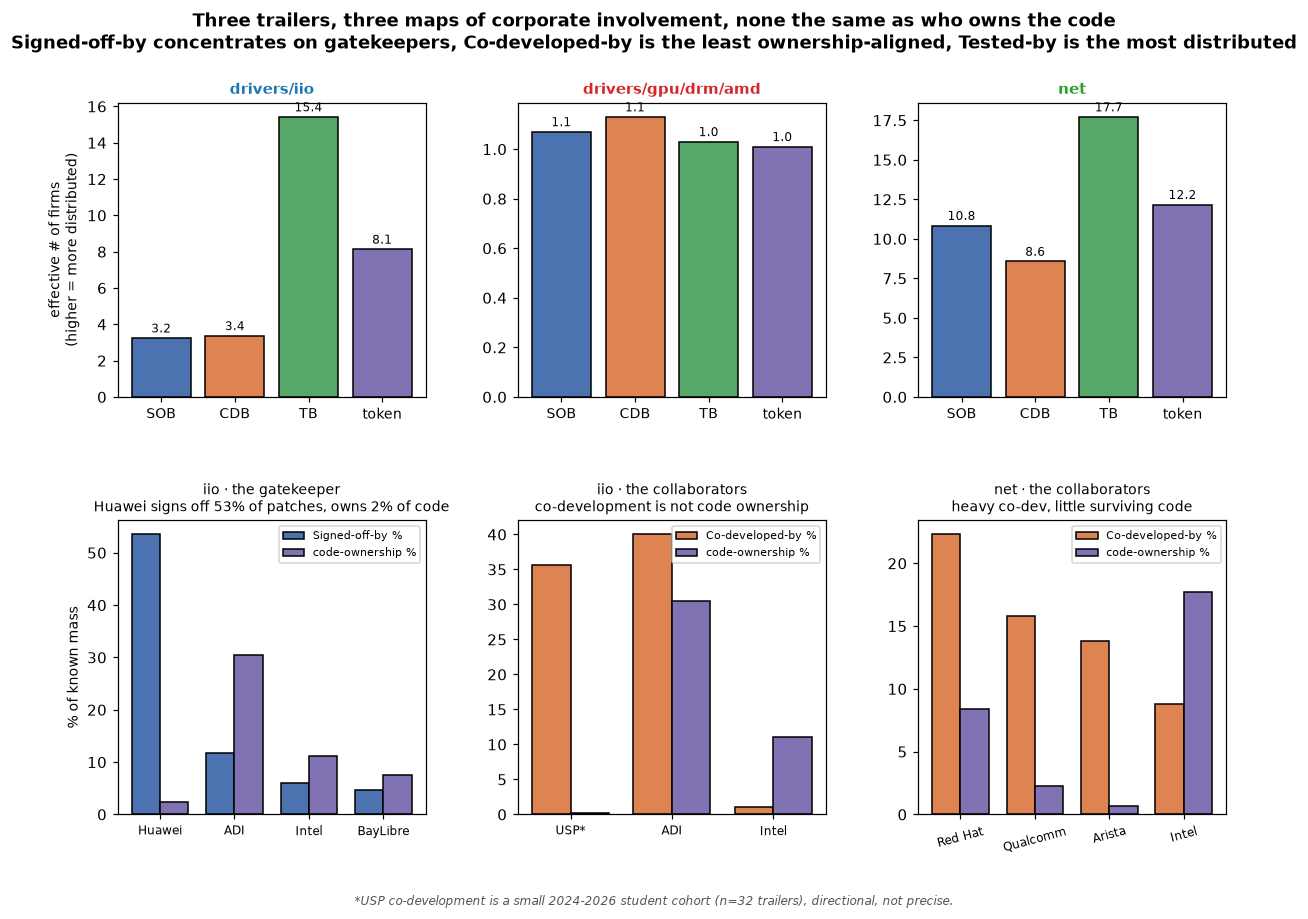
Three trailers, three maps. Top: how distributed each channel is (higher = more firms share it). Bottom: the named spikes — a firm can govern a subsystem, co-develop heavily, or validate broadly while owning little of the surviving code.
The sharpest single case is a gatekeeper. In iio, Huawei authors barely
2% of the surviving tokens but signs off on 53% of all patches — because
the iio maintainer, Jonathan Cameron, works there. A token census ranks Huawei
as a minor iio firm; the Signed-off-by channel reveals it effectively governs
the subsystem. The opposite pattern is the collaborator: in net, Red Hat,
Qualcomm, and Arista each co-develop far more than their code share (Qualcomm
and Arista own well under 3% of the code yet drive a chunk of its
co-development), hands-on work that ownership metrics cannot see. This is also
why the code-vs-review axis was the weakest agreement earlier: "review" was
really three signals averaged together, one concentrated and two distributed.
There is one thread I chased that mostly didn't hold up, and it is worth
reporting honestly. If cross-company collaboration reduces single-firm
dependence, then subsystems where firms talk across company lines on the mailing
lists should be less concentrated. The raw correlation looked strong, but it
collapses under a null model. The "expected" bar in the figure below is that
null: I hold each subsystem's thread sizes and each firm's total message volume
fixed, then randomly shuffle which firm sent each message and recompute the
cross-firm rate, averaged over many shuffles. That is the mixing you would see
purely by chance, given how many firms are present and how much each one talks.
Once you compare against it, every subsystem actually mixes less than
chance: firms are more siloed than random co-participation would predict, amd
most of all. What lowers concentration is more firms being present at all, not
cross-firm relationships per se. The comparison against the null is the whole
result here, which is why the figure keeps both bars: the observed rate alone
would misleadingly suggest net mixes the most, when the point is that it mixes
least relative to its opportunity. A neat hypothesis, and the data declined
it.
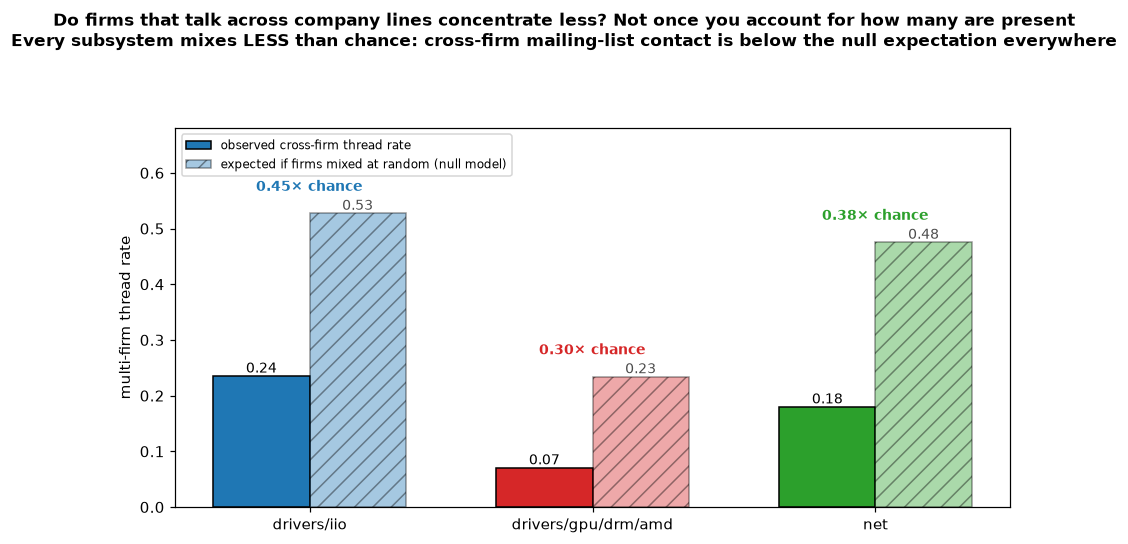
A hypothesis that didn't survive its confound. Cross-firm mailing-list contact is below the random-mixing expectation in all three subsystems, so the apparent link between mixing and lower concentration is really just "more firms present." Reported because negative results are results.
The firm outlives its people
There is an obvious objection to all of this. Kernel developers move around a lot. People change jobs, hand off drivers, and drift away from subsystems. So if knowledge is concentrated in a few companies today, surely all that individual churn erodes it over time? I went in expecting turnover to be the great leveller. It is not, and the way it fails to be is the most interesting thing I have found so far.
The clearest way to see it is to put two truck factors side by side over time: the classic individual one (how many people you remove before the code is orphaned) and the company one. Individual turnover is real and relentless: the person-level truck factor climbs steadily in every subsystem, roughly 2 to 39 in iio, 3 to 21 in amd, 5 to 37 in net, as more and more distinct people have to leave before the knowledge is lost. But the company truck factor barely moves. In amd it is literally pinned at 1 for twelve straight years while the individual figure octuples.
One note on reading this against the headline numbers: because this panel reconstructs the tree as it stood at the end of each year, it uses Avelino's original normalized-DoA definition of an expert (rather than the surviving-token rule behind the headline firm truck factors), so the firm line sits a little lower here, ending near 5 in iio and 6 in net instead of the headline 7 and 17. The two definitions disagree on the exact level, which is expected, but both put amd at 1 and both show the firm factor essentially flat while the individual one climbs. The shape of the gap, not its units, is the finding.
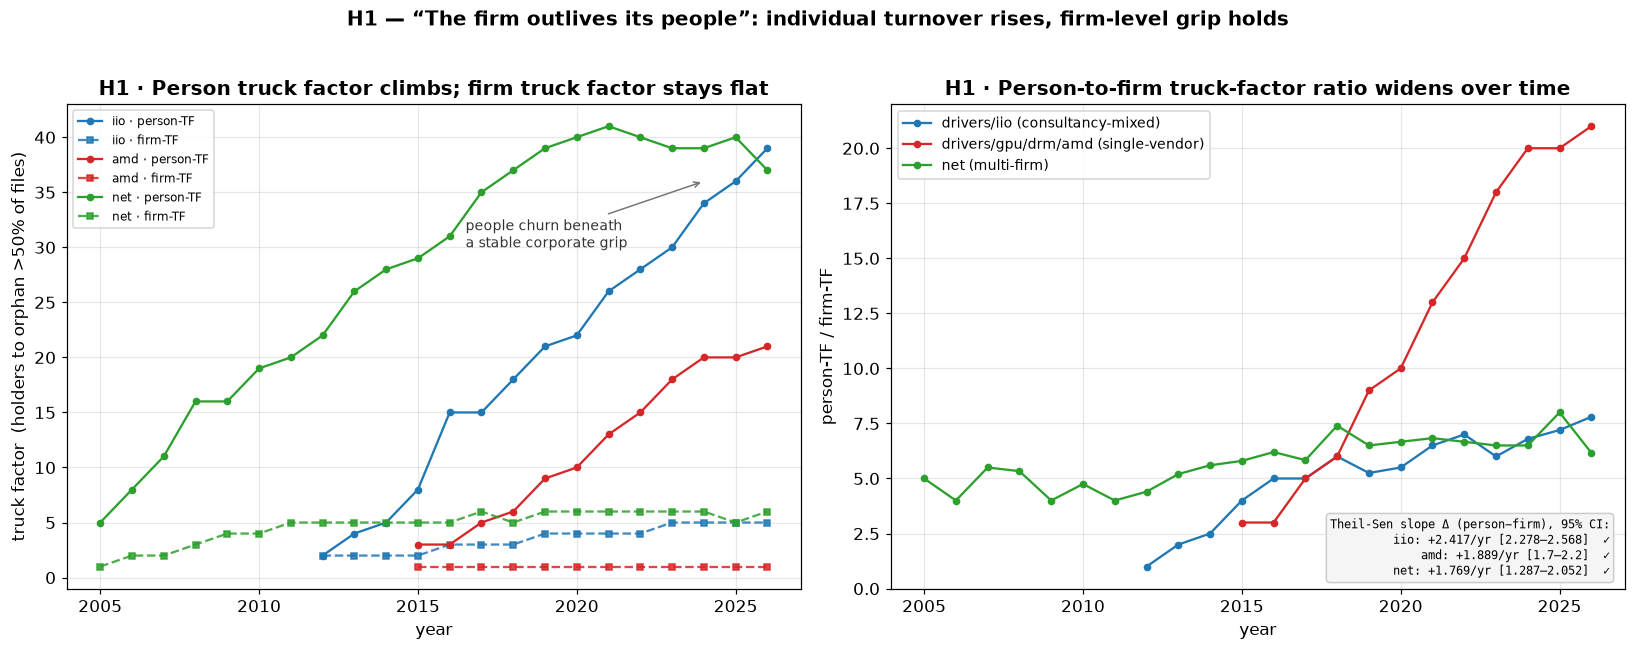
Individual turnover rises steeply while the firm-level grip holds. People churn beneath a stable corporate layer, and the gap between the two truck factors widens roughly sevenfold in iio and amd.
The trend lines on that second panel are fitted with a Theil-Sen slope, which is worth a one-line explanation because it does a lot of quiet work here. Rather than fit a single line by least squares, which one freak year (a big refactor, a mass file move) can tilt, it takes the slope between every pair of points and and uses the median of them all:
That makes it robust: a single outlier year cannot drag the estimate around. By that measure the individual truck factor pulls away from the company one by about 2.4 per year in iio, 1.9 in amd, and 1.8 in net, and the gap is statistically clear (the confidence interval excludes zero) in all three subsystems.
So the people churn, but the firm stays the durable unit that holds the knowledge. And when developers genuinely do switch employers, the effect is the opposite of what you might guess: reassigning each multi-firm developer to a single employer actually lowers the measured concentration. Mobility disperses knowledge; it does not enclose it.
Knowledge also outlives the people who wrote it. Around 12 to 15% of the
attributable code in iio and net was authored by companies whose developers
stopped committing three or more years ago and never came back, code that
persists in the tree long after its authors left. In net, half the living code
is more than a decade old. That is the individual-level echo of the
firm-withdrawal story above: when a contributor leaves, their code is usually
absorbed and carried forward, not orphaned. I want to be honest that this is a
survivorship view, since I can only see the tokens that are still alive today,
so it describes how persistent surviving knowledge is rather than a true decay
half-life, which would need a full year-by-year replay I have not run yet. But
the direction is consistent everywhere I look: the firm is what endures.
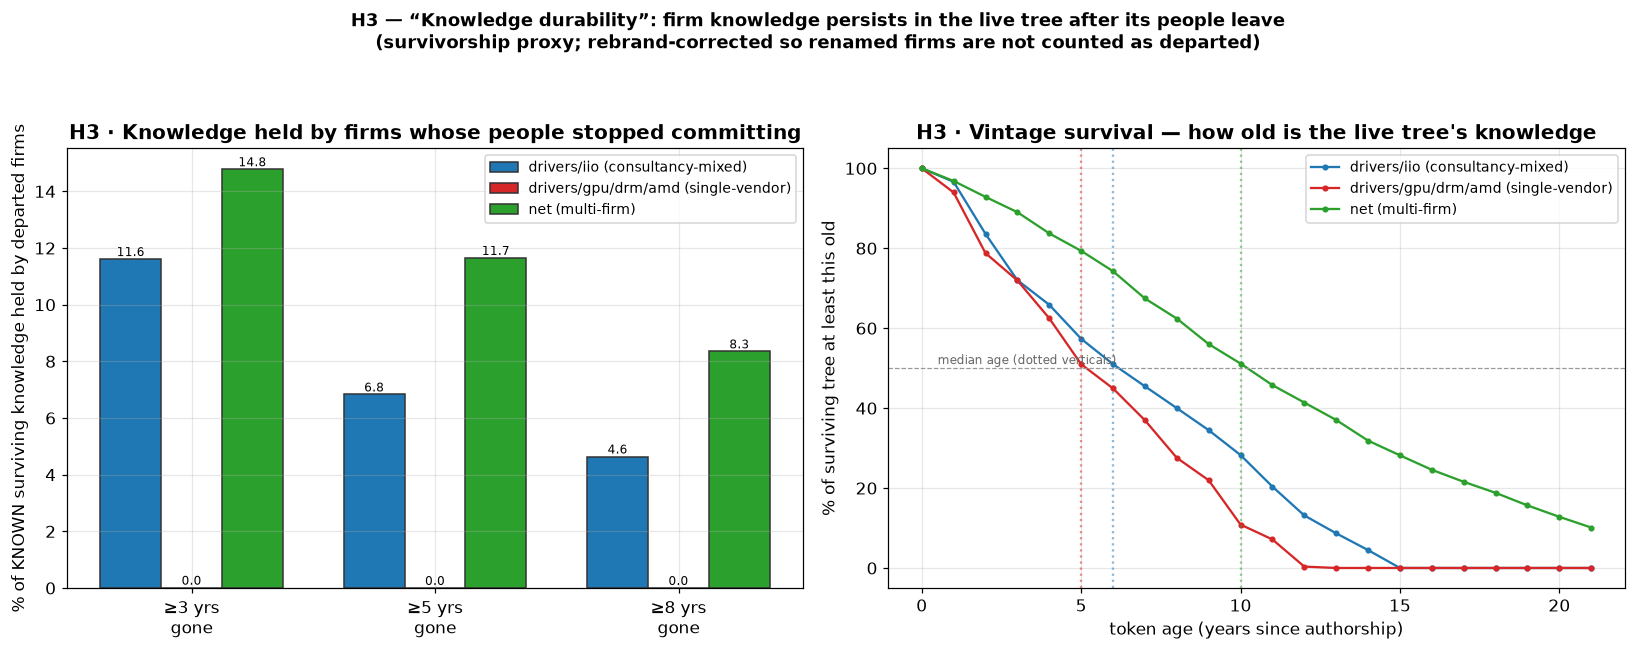
Knowledge durability. Left: 12–15% of iio/net code is still held by firms whose people left 3+ years ago (amd is ~0%, because its one vendor never leaves). Right: how old the living code is; net's median surviving token is about a decade old.
Next Steps
This is the start of my master's at IME-USP where I'll be diving deeper into these topics such as: firm-level truck factor for Linux kernel and the diverse implications of corporate contributions to OSS.
I expect to run the same amount of analysis for more subsystems and even for groups of subsystems. Another clear direction is to explore how the usage of AI influences on the knowledge and governance across Linux subsystems and OSS.